![]()
Metrics Definitions
Flask enables you to create patient-level metrics to measure study performance and progress.
Metrics can be computed using a pattern language referencing data variables in your study.
The Metrics pattern language
The pattern language was designed to enable you to create metrics of performance, exceptions, missing data, or critical values on the patient timeline.
The language uses item variable names - like $CHANGE_IN_SEVERITY.
Simple single variable expressions
You can use a simple expressions like $CHANGE_IN_SEVERITY == '0',
Count things
You can count things using COUNT and FILTER count($CHANGE_IN_SEVERITY ) == '0' or filter($PATIENT_REPORTED_RESTLESSNESS) == '0'.
Compound expressions
You can combine expressions using logical operators like &&(AND) or ||(OR).
Examples
$ELIGIBILITY == '1' && count($TREATMENT_SESSIONS) > '0'$CHANGE_IN_SEVERITY > 2 || $PATIENT_REPORTED_RESTLESSNESS == '0'count($CONMED) <= '5'
Functions
Counting things
count(variable, period)- the count function counts a variable entered in a time period.
The count function will return the number of records in the dataset where the variable has any value. If the count is 0 then the data is missing.
The count function takes 2 arguments:
- variable - the unique variable name of the CRF item.
- period - an optional time period counting data for each patient.
Period is a time interval like 24 hours
Info
You can use the following time units:
- milliseconds
- seconds
- minutes
- hours
- days
- weeks
- months
- years
Usage examples:
count($ADVERSE_EVENTS)- Count adverse events for each patients.count($ADVERSE_EVENTS, '24 hours')- Count adverse events for patients in the last 24 hours.count($ADVERSE_EVENTS, '7 days')- Count for the last 7 days- Say you want to find patients missing blood test data in the last 24 hours - you'd do this:
count($BLOOD_TEST, '24 hours') == '0';
The metric will have the value of 1 for all patients missing blood tests in the last 24 hours.
Filter - more complex counting
filter(variable, period, value, take) - the filter function enables you to filter on values looking forwards and backwards on the patient journey.
Like count, filter returns the number of records entered into the database for the variable.
Arguments:
- variable - the unique variable of the CRF item
- period - an optional time period for filtering patient data according to CRF create date.
- value - an optional filter using a comparison operator like
>2,yes,==5 - take - an optional argument to take the first N records or last N records in the dataset for each patient.
Info
You can use the following operators:
* `==`
* `!=`
* `>=`
* `<=`
* `>`
* `<`
Example
==2some string value>=5
the expression ==2 and 2 or ==yes and yes are equivalent!
The value of the take parameter will be a string like '-1', '1', '5'
The take parameter enables you to take events from the beginning or end of the patient timeline:
Examples
'1'- The first event'2'- The first 2 events'-1'- The last event'-4'- The last 4 events
the records returned from the database are ordered by date created.
Filter arguments are evaluated in this order:
- filtering by variable
- filtering by period
- filtering by 'take'
- filtering by 'value'
if you don't need to use some parameter you can set null instead.
Usage examples
filter($SCREENED)- count the $SCREENED variable for each patient.filter($EPRO_DIARY, '24 hours')- count 1 if any diaries were entered by each patient in the last 24 hoursfilter($TOOK_ANALGESICS, '24 hours', '>2')- count 1 for each patient who took pain analgesics more than twice in the past 24 hoursfilter($TOOK_ANALGESICS, null, '>2')- count 1 for each patient who took pain analgesics more than twice in the studyfilter($TOOK_ANALGESICS, null, '>2', '-2')- count 1 for each patient who took pain analgesics more than twice in the last 2 study events
You can do a comparison operation on the filter count and return a 0/false or 1/true for the metric:
filter($TOOK_ANALGESICS, '24 hours', '>2') > '0';
Or just do the filter count and return a number for the metric like this:
filter($ELSE_ONE_VARIABLE, '24 hours', '>2')
Under the hood of the pattern language for the curious
You can use a simple expressions like $AGE == '77'.
In this case this expression will be replaced to filter($AGE, null, '== 77') != 0
Example
| Input | Output |
|---|---|
$SOME_VARIABLE == '0' |
filter($SOME_VARIABLE, null, '== 0') != 0 |
$SOME_VARIABLE |
filter($SOME_VARIABLE, null, null) != 0 |
$SOME_VARIABLE == '3'&& $ELSE_ONE_VARIABLE > '2' |
filter($SOME_VARIABLE, null, '== 3') != 0 && filter($ELSE_ONE_VARIABLE, null, '>2') != 0 |
Examples of expression to the various components
| Component | Expression |
|---|---|
| INPUT | $ITEM_AT2_COMPONENT_INPUT == 'test' |
| NUMBER | $ITEM_AT2_COMPONENT_NUMBER == '5' |
| BIPOLAR NUMBER | $ITEM_AT2_COMPONENT_BIPOLAR_NUMBER['0'] == '3' |
| TEXTAREA | $ITEM_AT2_COMPONENT_TEXTAREA == 'test' |
| CHECKBOX | $ITEM_AT2_COMPONENT_CHECKBOX == 'true' |
| RADIO | $ITEM_AT2_COMPONENT_RADIO == '0' |
| BIPOLAR RADIO | $ITEM_AT2_COMPONENT_RADIO == '0' |
| MULTIPLE SELECT | $ITEM_AT2_COMPONENT_MULTIPLE_SELECT == '0' |
| SINGLE SELECT | $ITEM_AT2_COMPONENT_SINGLE_SELECT == '1' |
| PASSWORD | $ITEM_AT2_COMPONENT_PASSWORD == '12345678' |
| CHECKBO GROUP | $ITEM_AT2_COMPONENT_CHECKBOX_GROUP['0'] == 'true' |
| $ITEM_AT2_COMPONENT_EMAIL == 'some.mail@gmail.com' | |
| PHONE NUMBER | $ITEM_AT2_COMPONENT_PHONE_NUMBER == '380973768485' |
| DATE | $ITEM_AT2_COMPONENT_DATE == '2021-03-19T00:00:00.000Z' |
| DATE TIME | $ITEM_AT2_COMPONENT_DATE_TIME == '2021-03-19T13:15:00.000Z' |
| BIPOLAR DATE | $ITEM_AT2_COMPONENT_BIPOLAR_DATE['0'] == '2021-03-19T00:00:00.000Z' |
| TIME | $ITEM_AT2_COMPONENT_TIME =='2021-03-19T22:00:02.882Z' |
| FILE | $ITEM_AT2_COMPONENT_FILE == '1617024475170_rr.jpg' |
Add Metric
In order to add a metric click on ADD METRIC green button.

There are few properties of metric:
- Name - the name of the new metric.
- Trigger time - optional field, time of metric values generation. If this field is empty - metric values will generate in real time.
- Expression - see Expression
Run the study metrics
In the RUN option you can run your study metrics.
Click RUN green button to run your study metrics.
A success/error message will appear.
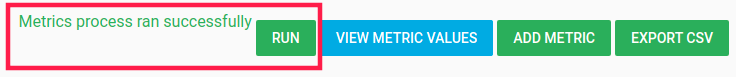
For view the result click on VIEW METRICS VALUE blue button.
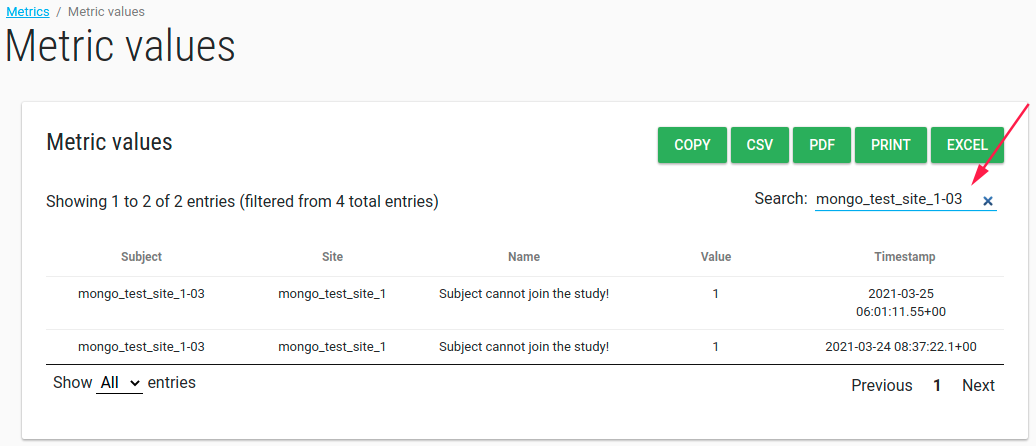
Study Metric Values
In the VIEW METRICS VALUE option you can view your study metric values.
Tip
You can filter the metric values table by any string, ordering by each column and export the table to COPY/CSV/PDF/PRINT/EXCEL.